
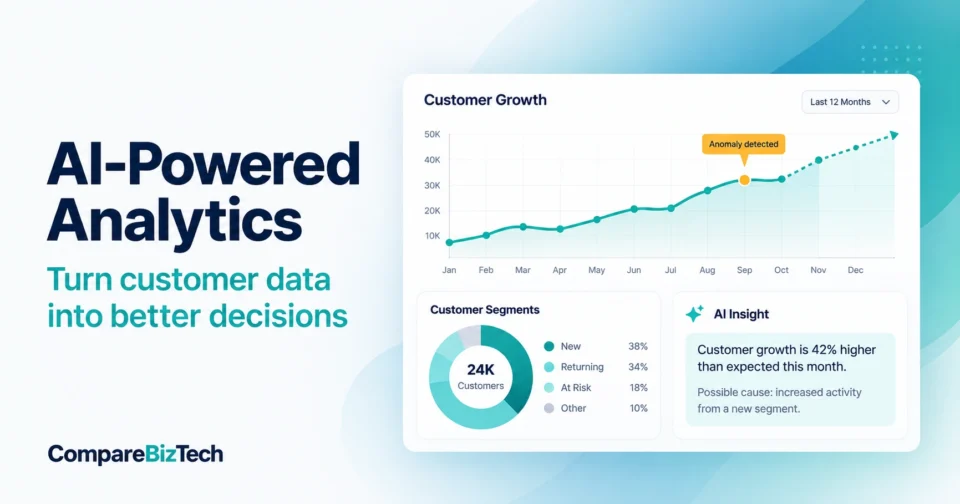
Most small businesses aren’t short on data. They’re short on time to actually use it. Sales numbers sit in one system, website traffic in another, and customer emails are scattered across a shared inbox nobody’s touched since March. Sound familiar?
That’s basically the whole reason AI-Powered Analytics exists. Not to give you more data, you’ve already got plenty, but to do the grunt work of finding patterns in it and telling you, in plain English, what actually matters. Fast enough that you can still act on it.
A five-person ecommerce shop can now type “why did returns spike last month” into a chat box and get a real answer back in seconds. Used to eat an analyst’s whole afternoon. So let’s get into what these tools really do, where they earn their keep, and where the marketing’s ahead of the reality.
What Is AI Analytics, Really?
AI business analytics is machine learning, and now large language models stacked on top, doing the job of making sense of data automatically instead of leaving a person to build every chart by hand. You’re not the one deciding what question to ask anymore. The system goes hunting for patterns on its own, flags things you’d never have thought to check, and lets you ask a question the way you’d ask a coworker, a normal sentence, not a line of code.
Picture a car with a plain rearview mirror versus one with a backup camera and sensors that beep before you hit something. That’s roughly the difference. Old analytics shows you what already happened. AI analytics tries to tell you why, and nudges you before the next thing goes wrong.
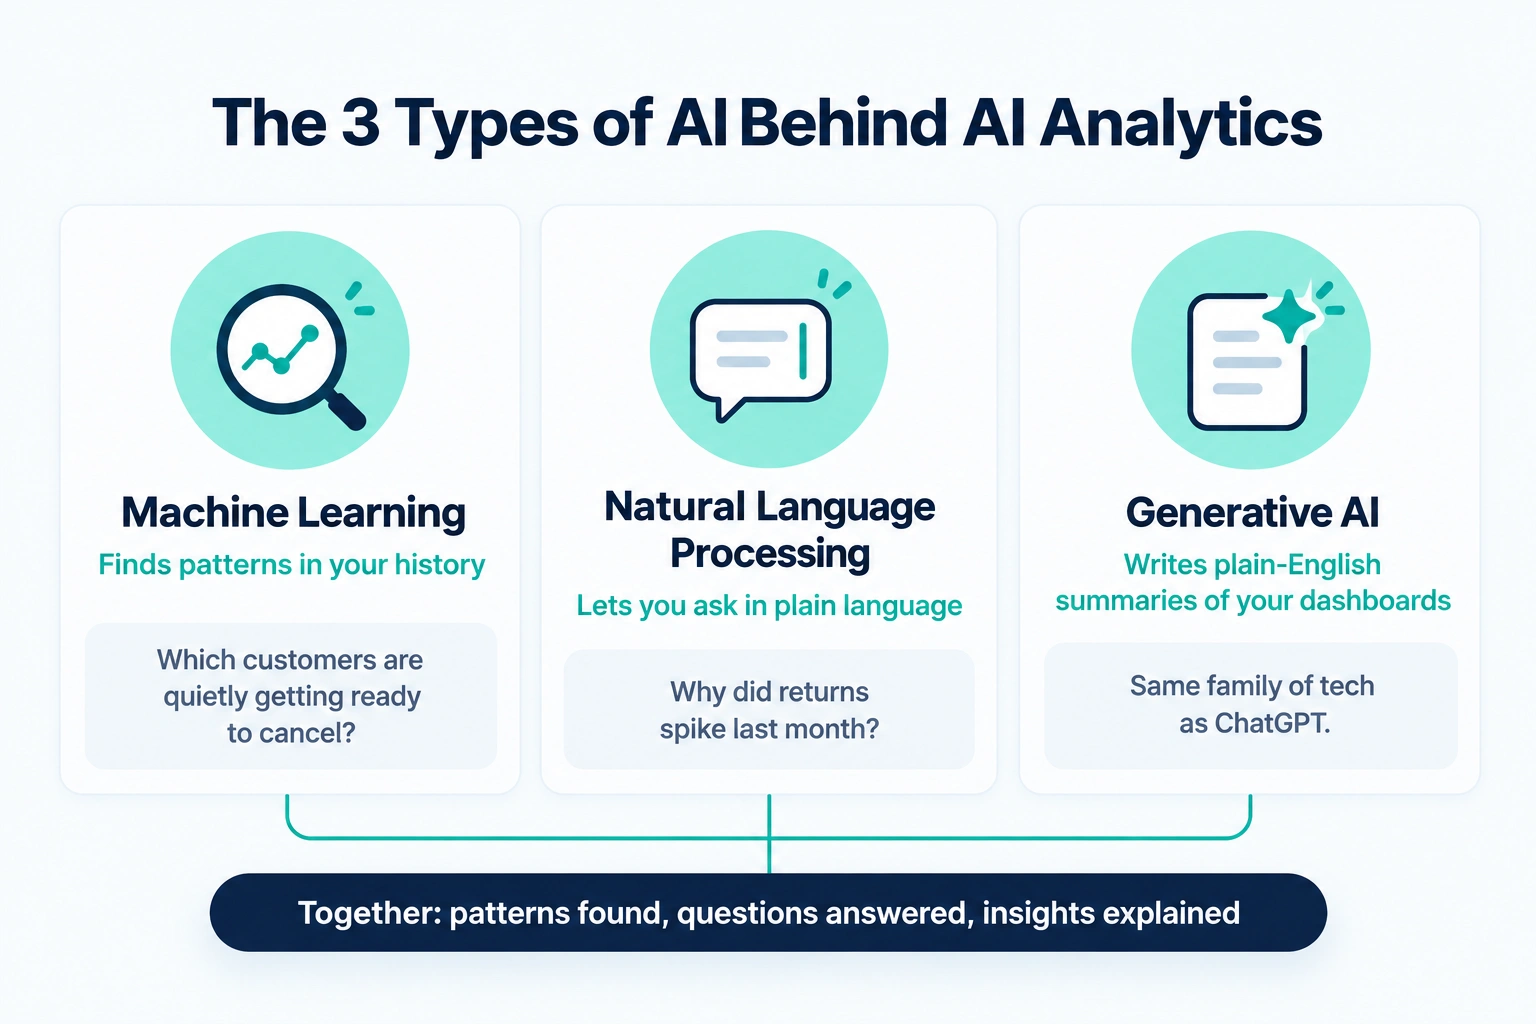
Three kinds of AI usually do the work. Machine learning digs through history for patterns, like which customers are quietly getting ready to cancel. Natural language processing lets you type or speak a question instead of coding one. And generative AI, same family of tech as ChatGPT, writes plain summaries of what’s happening in your dashboards so you’re not left staring at a bar chart trying to decode it yourself.
AI Analytics vs. Traditional BI
BI’s been around for decades. Power BI, Tableau, and the rest built their name on dashboards, drag-and-drop chart builders, scheduled reports. None of that’s going away. What’s changed is how much of the thinking these tools now do without you asking.
Old-school BI, you decide what to measure. A dashboard for weekly sales, one for churn, one for ad spend, then you go check them by hand every so often. The tool’s a mirror. Shows you whatever you point it at, nothing more.
Business intelligence AI puts a layer on top of that mirror. It watches your data on its own, no prompting needed, and surfaces things you’d never have thought to ask about. Tableau’s Pulse will tell you, out of nowhere, that West Coast sales dropped 12% this week, even if nobody built a dashboard for that number specifically. Power BI’s Copilot lets you type “summarize what changed in customer complaints this quarter” and hands back a written answer instead of another chart you still have to figure out yourself.
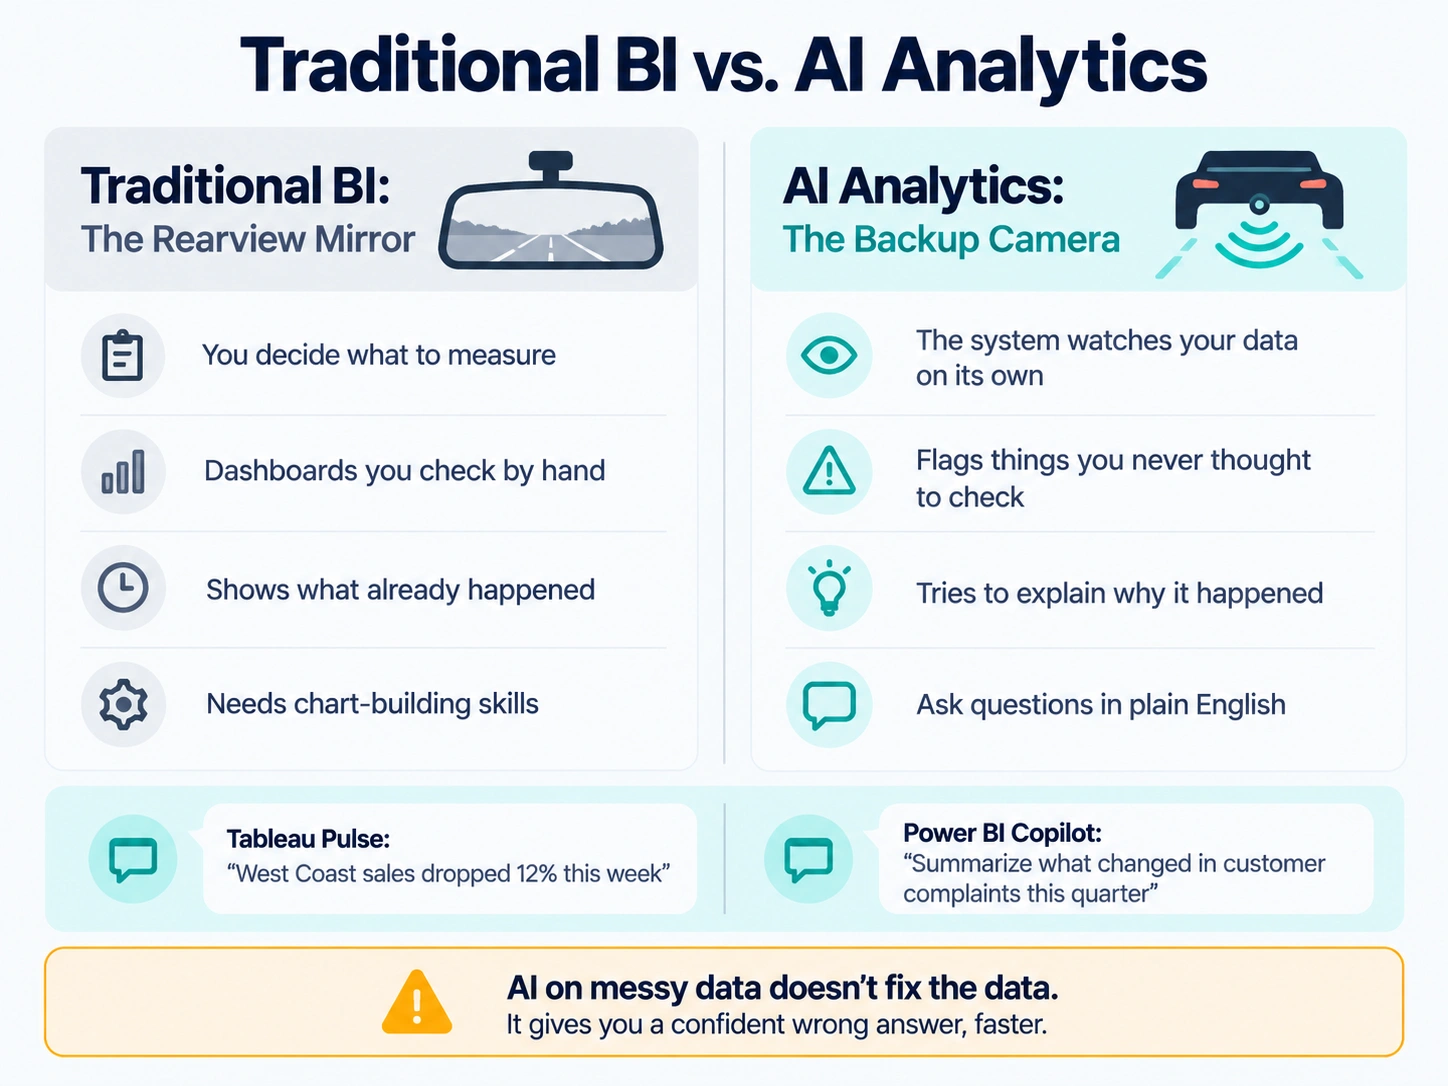
And here’s the part vendors don’t lead with in the sales pitch. AI on top of messy data doesn’t fix the data. It just hands you a confident wrong answer faster than a person would’ve reached a slow, uncertain one. Keep that in mind, it comes up again later, and it might be the single most important line in this whole piece.
Predictive Analytics: Seeing What’s Coming
Predictive analytics is where AI genuinely earns its keep for small and mid-sized businesses. Instead of reporting what already happened, it estimates what’s likely to happen next, based on patterns buried in your own history.
Churn prediction is the clearest example. Subscription businesses lean on it constantly. The model watches usage, support tickets, login frequency, payment history, then flags accounts likely to cancel in the next 30 to 60 days. Now your customer success team has a list to call before the cancellation happens, not a postmortem to write once it already did.
Demand forecasting works similarly for retailers and manufacturers trying to figure out how much to order. Get it wrong in either direction and it costs money, warehouse space and markdowns on one side, lost sales when you’re out of stock right as demand spikes on the other.
Sales forecasting too. Instead of a sales manager eyeballing the pipeline and guessing, the model weighs deal size, stage, rep history, and how similar deals closed before, then produces a forecast with a confidence range attached. HubSpot, Salesforce Einstein, Zoho CRM, they’ve all built some version of this into their pipeline views by now.
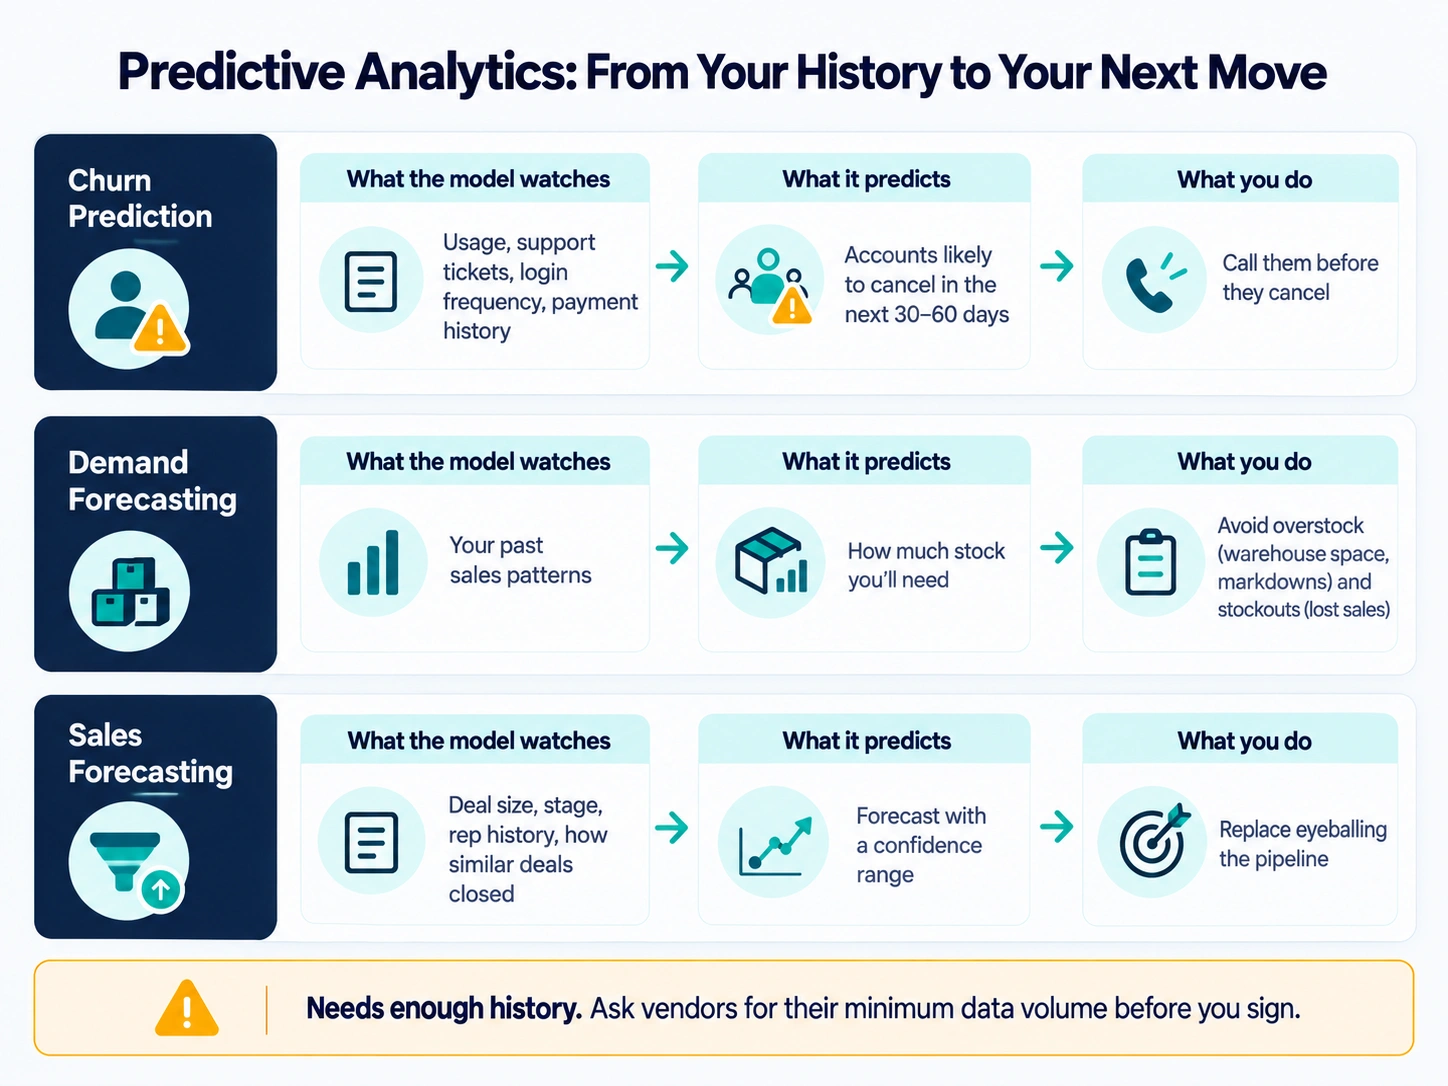
Quick thing worth knowing before you buy any of it. Predictive models need a decent stretch of history to actually be trustworthy. Business is eighteen months old with a thin transaction record? Don’t expect magic yet. Plenty of vendors will happily sell you a forecasting feature anyway, even when there’s not nearly enough data behind it to make that forecast mean anything. Ask what minimum data volume they’d recommend before signing.
Customer Analytics: Understanding Who’s Actually Buying
This is the part of customer analytics you can actually feel, because it answers the kind of questions you’d ask a sharp employee if you had one sitting on top of all your customer data full time.
Who are your best customers, and what do they actually have in common? Which ones are drifting toward churn? What’s the real lifetime value of someone who came in through a Facebook ad versus organic search? AI-driven segmentation groups people by real behavior instead of you writing manual rules like “spent over $500 in the last 90 days.” It finds groupings you’d never think to look for on your own, weekend shoppers who love a bundle deal, say, versus full-price weekday buyers who never touch a discount code.
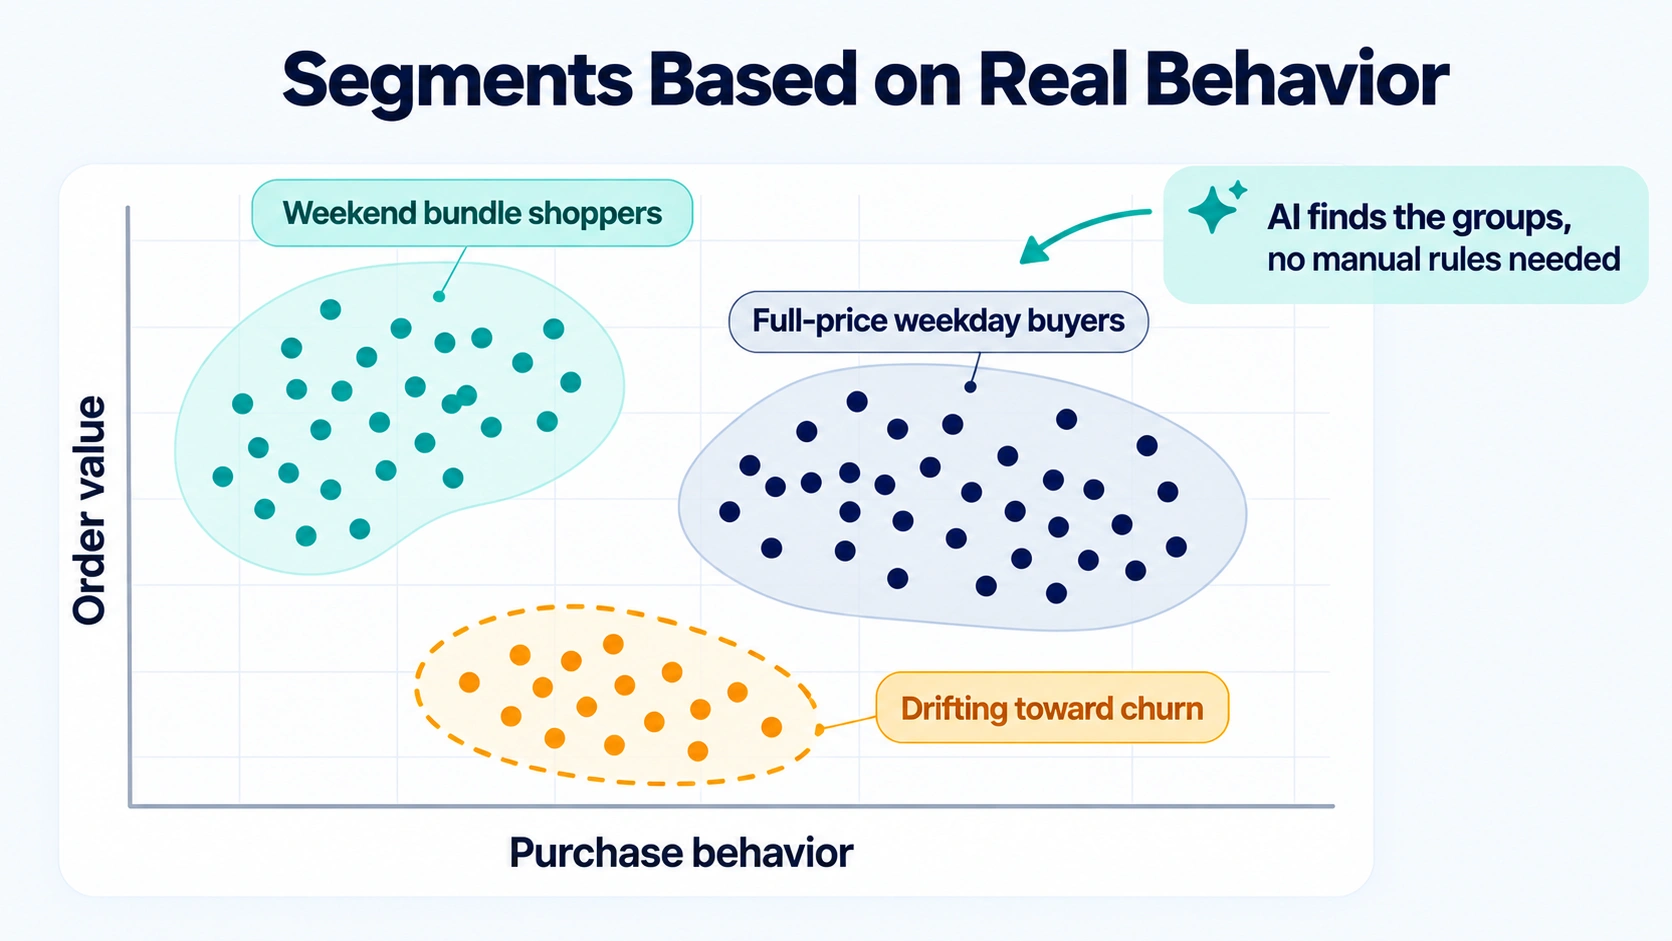
Ecommerce platforms lean into this hard. Shopify’s built-in analytics, paired with apps like Triple Whale or Lifetimely, use AI to calculate lifetime value and work out which segments are actually worth spending more to acquire. That number matters, because most small ecommerce businesses are basically guessing at their real payback period on ad spend. Guess wrong there long enough and it quietly drains a marketing budget for months before anyone catches it.
Sales Forecasting and Marketing: Where the ROI Shows Up Fastest
Trying to justify the cost of an AI analytics tool to a boss or a business partner? Sales and marketing are where payback shows up fastest, because the decisions being informed carry a dollar figure right away.
On the sales side, AI scoring ranks leads by likelihood to close, so reps spend limited time on the right accounts instead of working the list top to bottom like it’s 2009. On the marketing side, **AI data analysis** attributes revenue back to specific campaigns more accurately than the old last-click model ever managed, which matters a lot when you’re deciding whether to keep funding that Instagram campaign or shift the money to email instead.
Google Analytics 4‘s AI panel flags an unusual traffic spike or a sudden drop in conversion on a specific page, no digging required. Meta’s Advantage+ campaigns shift ad spend in real time toward whatever audience is actually converting. None of this replaces a marketer’s judgment; to be clear, it just trims the hours spent staring at spreadsheets trying to spot what the AI would’ve caught in seconds anyway.
Fraud Detection and Anomaly Detection
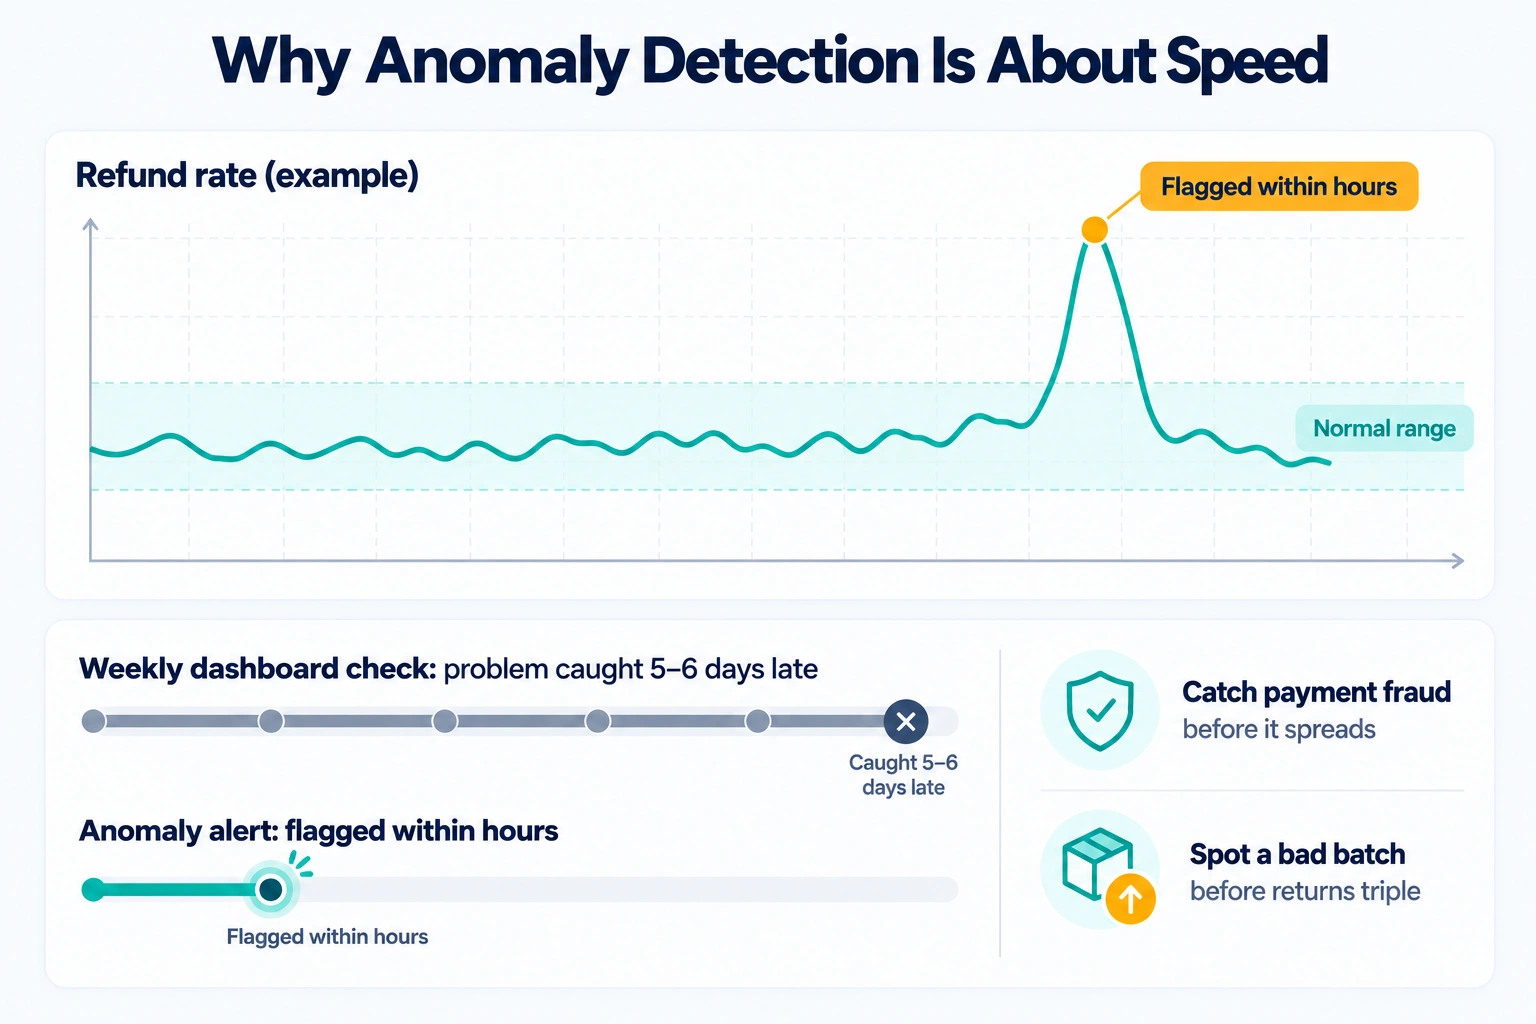
Less flashy than everything above, but genuinely high-value. Anomaly detection means the system learns what “normal” looks like for your business, then flags anything drifting away from it, so you’re not stuck writing a rule for every possible scenario by hand.
For ecommerce and fintech, that’s catching a fraud pattern before it costs thousands, or noticing a specific product’s return rate just tripled, which might mean a bad batch shipped. Stripe Radar handles this for payment fraud specifically, scoring risk on every transaction in real time based on patterns learned across millions of others. For broader operational stuff, Power BI’s anomaly detection visual or Sisense’s AI alerts flag a metric that moved outside its normal range, site traffic, refund rates, inventory turnover, whatever it happens to be.
The real value here is speed, plain and simple. Someone checking dashboards once a week might catch a problem five or six days late. An anomaly system can flag it within hours.
Natural Language Analytics: Just Ask the Question
Maybe the biggest shift of the last couple years, and the part that matters most if you’re not technical yourself. No pivot table, no database query. You just type the question.
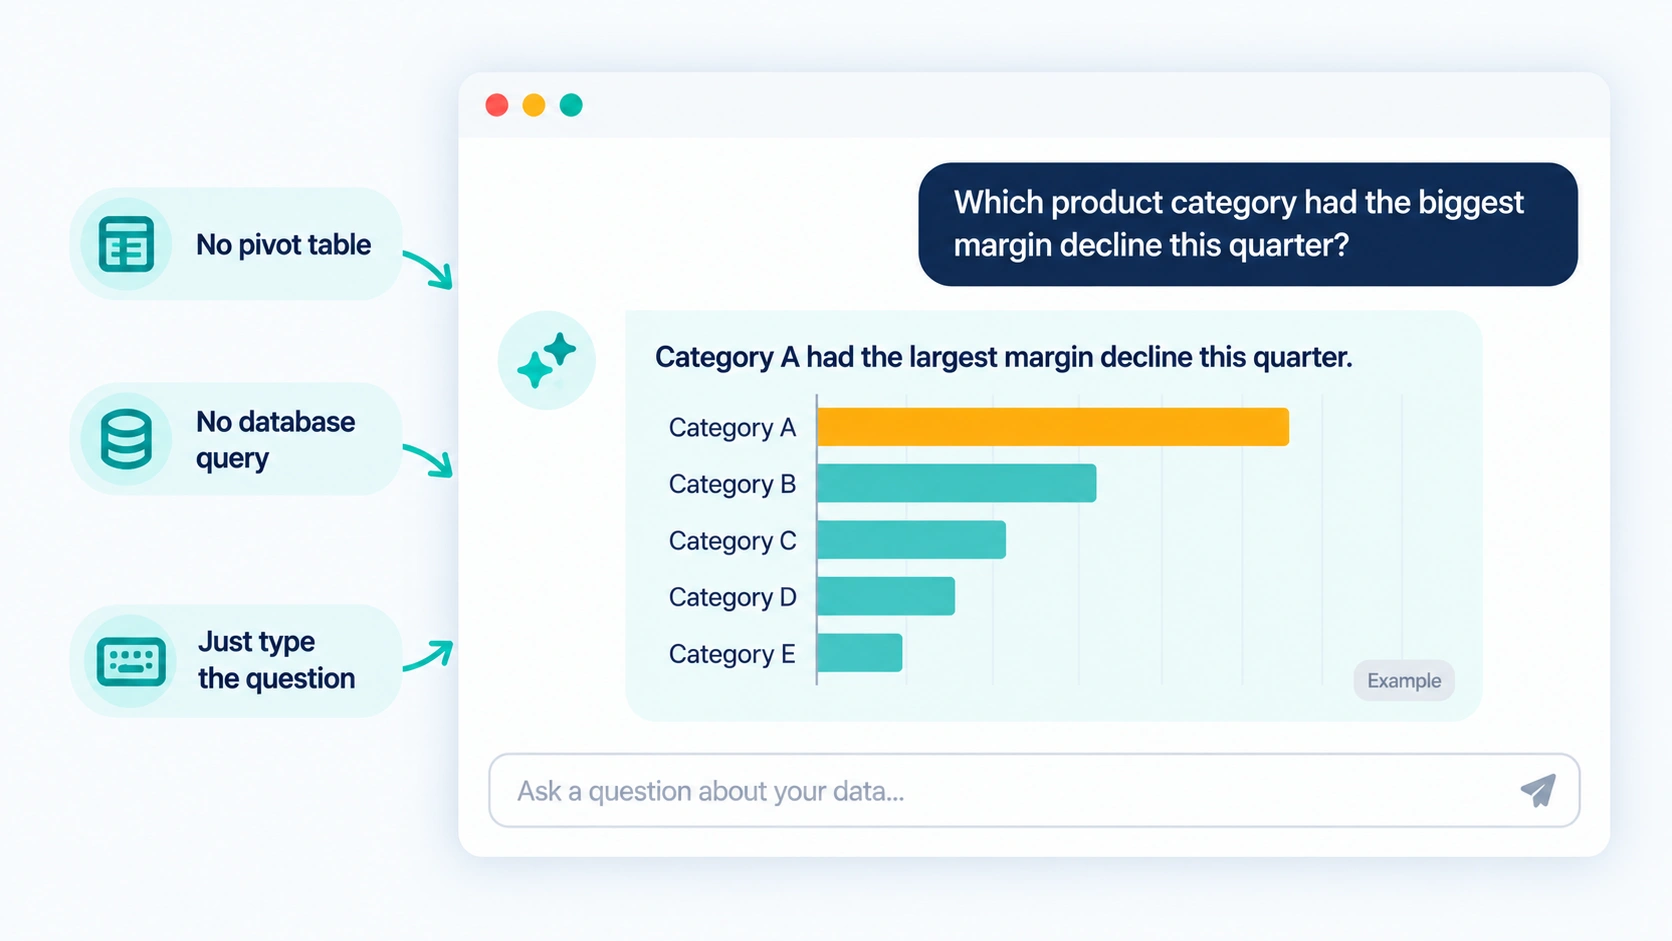
Microsoft’s Copilot in Power BI lets you type “which product category had the biggest margin decline this quarter” and it writes the query, builds the chart, and explains the answer in a sentence. That needs a Premium Per User license at $24 a month, or Fabric capacity starting around F64, so realistically it’s out of reach for very small teams unless you’re already deep in the Microsoft world. Zoho Analytics has something similar called Zia, built into paid plans starting around $30 a month for two users, a far easier entry point if budget is tight. ThoughtSpot’s Spotter does much the same with a more enterprise-grade search experience, starting at $25 per user a month on Essentials, though it caps at 50 users and 25 million rows.
One catch worth flagging. Natural language analytics is only as good as the data model underneath it. Messy or unlabeled data, and the AI misreads ambiguous questions, then hands you a confidently wrong answer. It’s not lying on purpose, it’s guessing its best against bad inputs, and it won’t always let you know that’s what’s happening.
Dashboards Are Getting Smarter, Not Disappearing
Dashboards aren’t going anywhere. They’re just less of a chore to build and read these days. Instead of designing every chart yourself, AI-assisted tools suggest visualizations based on whatever you connect, and increasingly write a short summary up top explaining what changed and why. No more squinting at a line graph trying to work out what it’s actually telling you.
Tableau Pulse pushes those summaries straight into Slack or email, so the insight comes to you instead of you remembering to log in and go hunting for it. Real quality-of-life upgrade if you’re a busy owner who doesn’t have time to open a dashboard every morning.
The Part Nobody Wants to Talk About: Data Quality
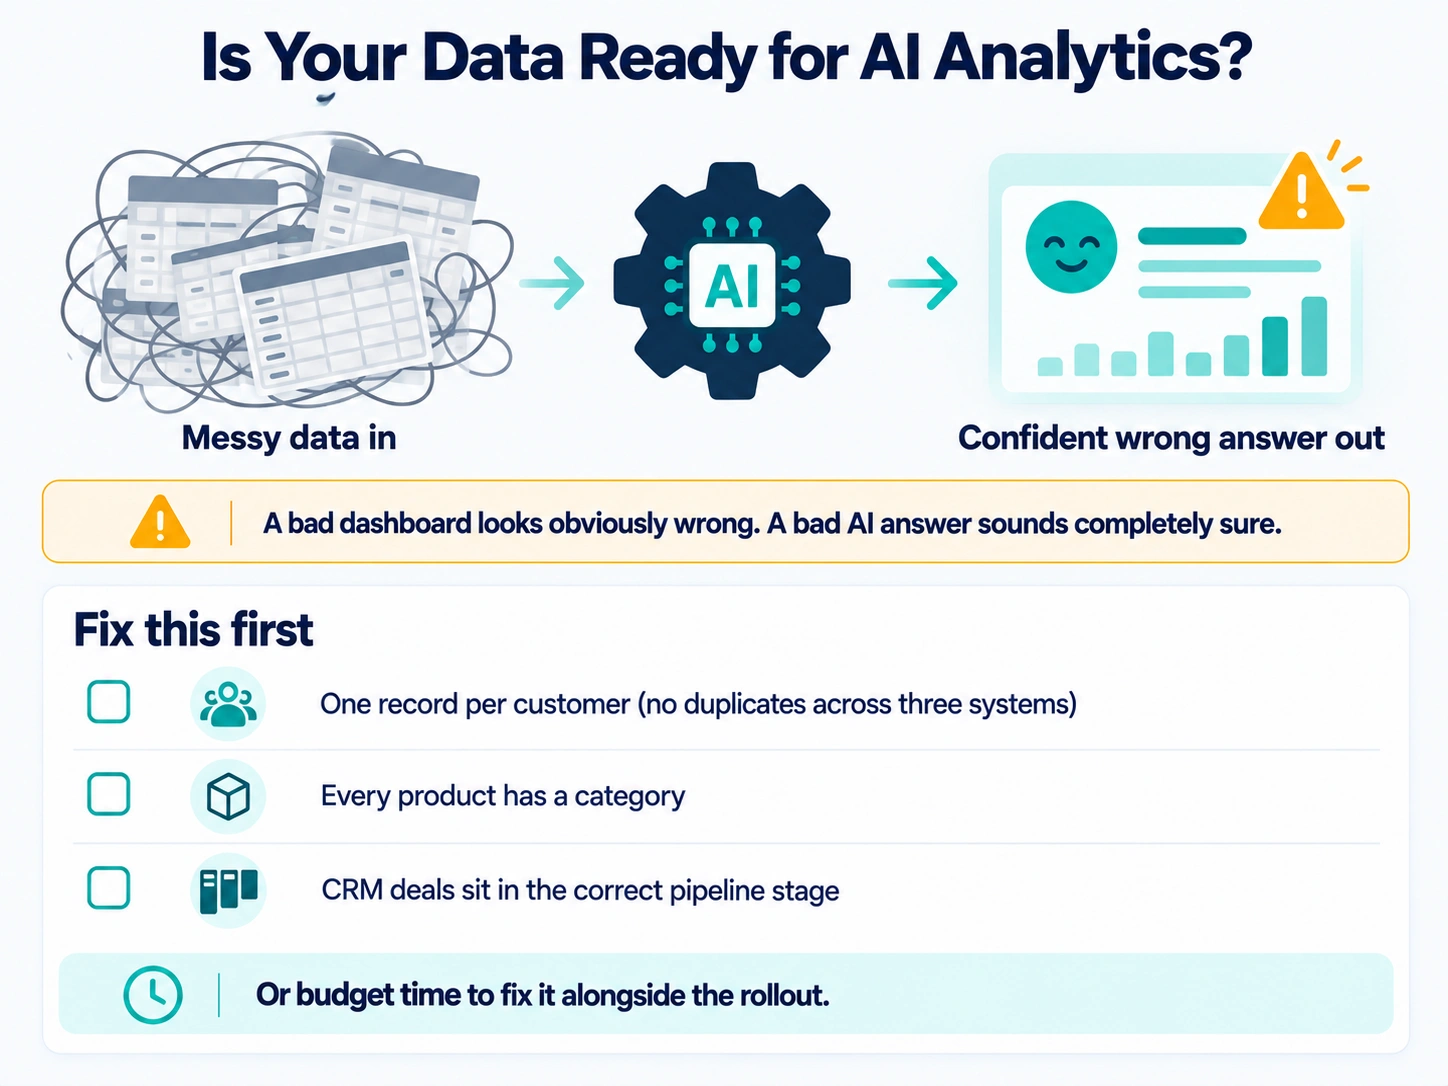
Here’s what most AI analytics marketing conveniently skips over. None of this works if your underlying data is a mess. Garbage in, garbage out isn’t a new problem, but AI makes it worse in a specific way. A badly built dashboard is obviously wrong, blank chart, error message, you know instantly. A badly trained AI model hands you a wrong answer that sounds completely sure of itself. That’s more dangerous, not less, because you’re far less likely to double-check something that confident.
So before spending a dime on this, take an honest look at whether your data’s even ready. Customer list duplicated across three systems with slightly different spellings of the same company name? Half your product catalog missing categories? Deals sitting in the wrong pipeline stage because nobody bothers updating the CRM? Fix that first. Or at least budget time to fix it alongside the rollout. Otherwise, you’re paying good money for AI that spends all day analyzing noise.
Privacy Matters More Than It Used To
Feeding customer data into an AI system raises questions a plain dashboard never did. Where does that data actually go once it leaves your system? Is the vendor training their broader model on your customers’ information, or keeping it walled off to your account only? Most enterprise-grade tools, Power BI, Tableau, Zoho, now offer contractual guarantees that your data doesn’t train shared models. But you have to actually read the data processing agreement to confirm it. Don’t just take a sales rep’s word for it.
Handling sensitive data, health details, financial records, anything under GDPR or CCPA? Ask specifically about data residency, where it’s physically stored, and whether AI features can be switched off for certain fields. Most platforms now let you exclude specific columns from AI processing entirely. Set that up before connecting anything, not after the fact.
Picking a Tool: A Quick, Honest Rundown
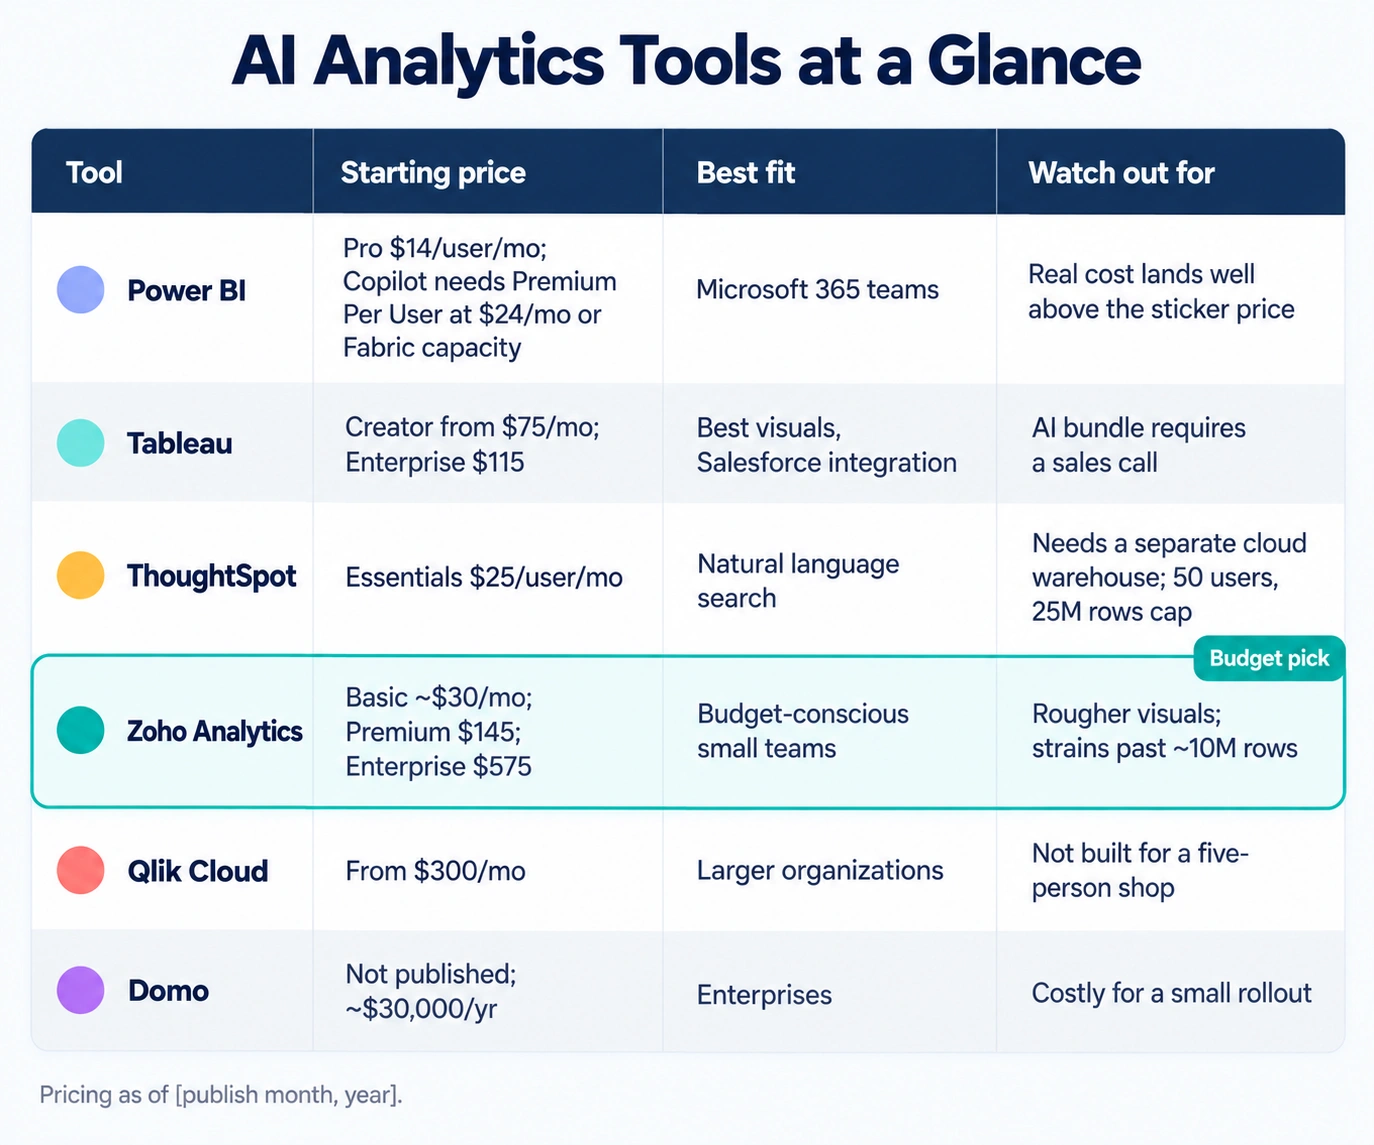
No single best tool here, only a best fit for your size and budget. A few honest notes on where the major players actually land for smaller businesses.
Power BI
It makes the most sense if you’re already on Microsoft 365 and your team can stomach a bit of a learning curve. Pro licenses run $14 per user a month, but that’s not the AI part. Copilot needs Premium Per User at $24 a month, or a Fabric capacity subscription on top of that, so the real cost lands well above what the sticker suggests.
Tableau
It has the best visualizations in the business, no argument there. But it’s priced to match. Creator licenses start at $75 a month, climbing to $115 on Enterprise, and the AI bundle needs an actual sales call, no published price anywhere on the site. Great if visual polish and Salesforce integration matter to you. A waste if all you want is a straight answer, not a work of art.
ThoughtSpot
It earns a look specifically if natural language search is what you care about most, and you’re willing to pay for it. $25 per user a month on Essentials sounds reasonable until you remember you’ll also need a separate cloud data warehouse, Snowflake or BigQuery, to actually connect it to. That’s an extra cost most comparisons quietly skip.
Domo and Qlik
Both of them lean hard enterprises. Domo won’t even publish pricing, realistically starting around $30,000 a year for a small rollout. Qlik Cloud starts at $300 a month on its smallest tier. Neither one’s built for a five-person shop, and you’ll feel that in the sales process before you even get to a demo.
Zoho Analytics
It is the one I’d point a genuinely budget-conscious team toward. Starts around $30 a month for Basic, climbing to $145 for Premium and $575 for Enterprise. Solid pick for small teams already inside the Zoho ecosystem. Just know the visuals are rougher than Tableau’s, and things start to strain past roughly 10 million rows.
Thinking About ROI Honestly
Don’t buy an AI analytics tool because it looked slick in a demo. Buy it because you can point to one specific decision it’ll make faster or better. Will it help you stop losing customers who were about to walk? Will it catch fraud before it costs real money? Will it tell your marketing team exactly where to put next month’s ad budget?
Add up the real cost honestly. License, any data warehouse it needs plugged into, the hours your team spends setting it up and cleaning the data feeding it. Then weigh that against a specific, measurable outcome, not a vague promise of “better decisions.” A tool that costs $300 a month but genuinely helps you catch churn a month earlier pays for itself many times over. A tool that costs $50 a month but nobody on your team actually opens? That’s just money burned, no matter how good its AI is supposed to be.
The businesses getting real value out of this aren’t the ones with the fanciest tool. They’re the ones who picked something that actually matched their data maturity, and stuck with it long enough to build real habits around checking it.

The Team Compare BizTech is made up of people from marketing backgrounds, digital marketing & content marketing backgrounds, each with unique experiences and nuggets of wisdom to share with you. The team is passionate about creating unique, accurate, and engaging content.